In a week characterized by tightrope trading, Bitcoin finds itself on the cusp of forming a third consecutive Doji candlestick pattern on its weekly chart. Regrettably, the cryptocurrency domain failed to find solace in the equity markets of the United States, which concluded the week on a somber note. The S&P 500 Index stumbled by 1.3%, while the Nasdaq, in tandem, descended by 1.9%.
Bitcoin’s prevailing weakness has cast a shadow over numerous altcoins, with many flirting with multi-week nadirs. This disheartening trend is emblematic of the crypto market’s relentless bearish clutches. Such an atmosphere renders short-term bullish trading endeavors an arduous task, as fleeting rallies struggle to gain traction. Yet, the present predicament presents an opportune moment for steadfast long-term investors to strategically assemble their portfolios.
A recent report from Amberdata reveals a noteworthy trend in the asset management sector: a staggering 24% of firms are in the process of enlisting senior executives expressly committed to the execution of digital strategies. This strategic shift is poised to usher in a substantial transformation, with an additional 13% of firms slated to embark on the journey of digital asset integration. This collective shift underscores not only the seriousness of intent but also the buy-in from top-tier management.
Could Bitcoin’s impending breakout serve as the catalyst to reignite interest in altcoins? In this comprehensive analysis, we scrutinize the charts of the top five cryptocurrencies that exhibit promising indicators in the short term.
Bitcoin Price Analysis
Bitcoin has been entrenched in the vicinity of the $26,000 level for several days, indicative of a relentless tug-of-war between bullish and bearish forces.
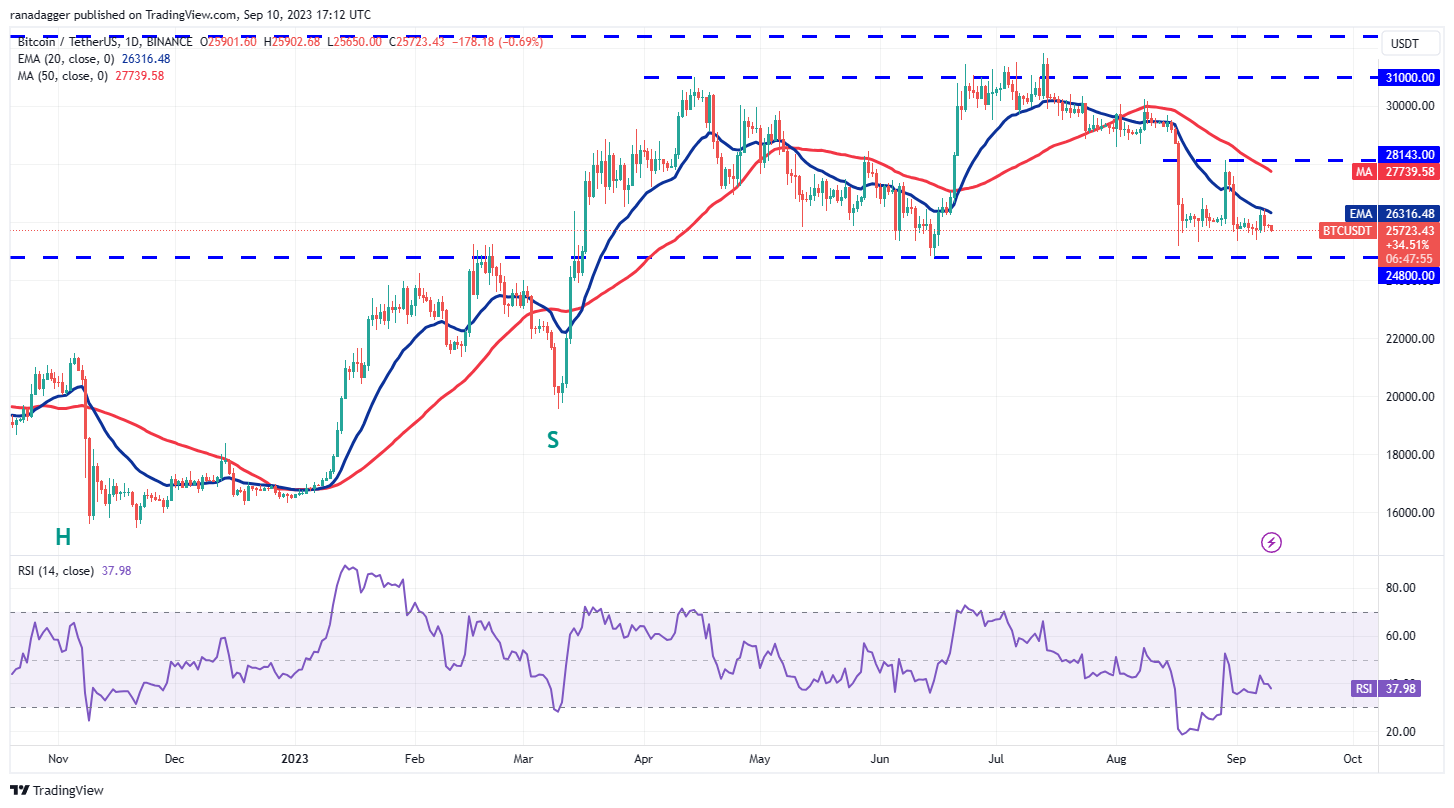
Although the downsloping moving averages tip the scales slightly in favor of the bears, a glimmer of hope emerges from the positive divergence witnessed on the relative strength index. This divergence hints at a gradual easing of the selling pressure. The conflicting signals emanating from these indicators obfuscate the decisive advantage between the bulls and bears.
Prudent investors would be well-advised to exercise restraint until the price either consolidates above $26,500 or plunges beneath $24,800 before considering substantial commitments.

Should the bulls surmount the $26,500 hurdle, the BTC/USDT pair may ascend towards the overhead resistance at $28,143. Conversely, a breach below $24,800 could potentially clear the path for a precipitous drop to $20,000.
A cursory glance at the 4-hour chart reveals a listless struggle, with the price meandering near the moving averages. Such an equilibrium is unlikely to persist indefinitely and may herald a forthcoming expansion in the trading range.
A decisive rally above $26,500 would signal a shift in favor of the buyers, setting the stage for a prospective rally to $27,600, eventually targeting $28,143. Conversely, a breach below $25,300 could intensify selling pressure, leading to a retest of the August 17 intraday low at $25,166.
Toncoin Price Analysis
Toncoin (TON) has retraced to the comforting embrace of the 20-day exponential moving average ($1.69). Within an uptrend, such a correction to the 20-day EMA often serves as a low-risk entry point for astute traders.
The 20-day EMA, a formidable bastion of support, is poised to validate bullish sentiment if the price stages a spirited recovery from this level. Such a resurgence would signify renewed investor confidence, with the TON/USDT pair eyeing an initial ascent to $1.89, followed by a challenging rally to $2.07.

However, a continued descent below the 20-day EMA would foreshadow bearish capitulation, heralding the possibility of a drop to $1.53, and subsequently, a rendezvous with the 50-day simple moving average ($1.45).
The 4-hour chart hints at a tussle between the bears and bulls, with the former endeavoring to breach the immediate support at $1.72. Resilience among the bullish camp, however, has thwarted the bears’ advances. The presence of a downsloping 20-EMA, coupled with the RSI languishing in negative territory, elevates the risk of a potential breakdown.

Should the $1.72 support yield, the pair could plummet to $1.66, with a further nosedive beckoning at the sturdy support level of $1.53. Conversely, if the bulls propel the price above the moving averages, it would signal the dawn of a robust recovery, with targets set at $1.90 and eventually $2.
Stellar Price Analysis
Stellar has orchestrated an impressive comeback in recent days, signaling the resurgence of bullish sentiment.
The XLM/USDT pair surged above the 20-day EMA ($0.12) on September 4, with the bulls staunchly defending this critical level against bearish incursions on September 5 and 6. This concerted effort reflects the bulls’ determination to transform the 20-day EMA into steadfast support.

Presently, the price has gravitated toward the 50-day SMA ($0.13), which stands as a formidable roadblock. Encouragingly, the bulls have relinquished minimal ground, implying a reluctance to cede control. A triumphant breach above the 50-day SMA could catapult the pair to $0.15, ultimately targeting $0.17.
However, this optimistic outlook would be compromised if the price retraces and descends below the 20-day EMA.
The bears endeavor to obstruct the recovery at the overhead resistance of $0.13, yet the bulls remain steadfast. A rebound from the 20-EMA suggests a persistent appetite among buyers for lower price levels. A sustained presence above the overhead resistance could catalyze a rally toward $0.15.

To thwart such an ascent, the bears must swiftly drag the price below the 20-EMA, potentially leading to a descent toward the 50-SMA.
Monero Price Analysis
Monero has tenaciously clung to the support of the ascending trendline in recent days, signaling bullish support at lower levels. The price now contends with the pivotal 20-day EMA ($143), a critical level to monitor.
Should the bulls succeed in propelling the price above the 20-day EMA, it would augur the inception of a robust recovery. The XMR/USDT pair could then aim for the 50-day SMA ($151), where a stern resistance battle may ensue. Subsequently, clearing this hurdle would pave the way for a surge toward $160.

Conversely, the bears may have their own agenda, aiming to protect the 20-day EMA and wrest control, subsequently plunging the price below the ascending trendline. Such a development could trigger stop-losses, precipitating a sharp drop to $130.
The 4-hour chart unveils the emergence of a symmetrical triangle pattern. The muted moving averages and the RSI hovering near the midpoint underscore the precarious equilibrium between bulls and bears. A decisive break above or below this triangle may herald the advent of a significant directional move.
Maker Price Analysis
Maker finds itself ensnared between the moving averages, emblematic of the ongoing indecision between bullish and bearish contingents. Nevertheless, a faint glimmer of hope for the bulls lies in the price’s retention above the downtrend line.
The 20-day EMA ($1,119) embarks on a gradual ascent, though the RSI languishes near the midpoint, indicative of subdued bullish momentum. The resurgence of bears could rekindle downside pressure, potentially leading to a re-entry into the downtrend line. This scenario would see the MKR/USDT pair slip toward the formidable support at $980, anticipated to trigger vigorous buying interest.

On the 4-hour chart, Maker’s price action oscillates between $1,083 and $1,170, illustrating a period of consolidation. The flatlining moving averages, coupled with the RSI residing in negative territory, confers a marginal advantage to the sellers.
Critical support levels to monitor on the downside include $1,102 and $1,083. Conversely, a bullish resurgence from current levels, surmounting the moving averages, would signal a potential comeback for the bulls, with the pair setting its sights on $1,170.
The cryptocurrency market remains at a crossroads, with Bitcoin’s uncertain trajectory casting a shadow over the broader altcoin space. As market participants await clearer signals, the interplay between bulls and bears continues to shape the landscape of digital assets. Vigilant investors stand poised to navigate these turbulent waters with caution and strategic acumen.